An introspection graph
A causal graph to guide one's introspection on problems of life.
An introspection graph
Context
Dear Young Tim,
This post follows the recent stream of psychology focused dispatches. The context is the familiar one: we face problems in life where there are discrepancies between feelings we have and feelings we want and between outcomes we have and outcomes we want. To achieve the feelings and outcomes we desire, it is helpful to understand how we came to our undesired states in the first place. Moreover, I believe we increase our probability of successfully achieving our goals by systematically investigating the factors currently causing our issues.
In particular, I think it’s helpful to have a set of questions to start from when trying to understand our personal problems. Of course, having a collection of questions is only the first step. Humans have great difficulty holding numerous items in our mind at once, so we’re going to want to chunk these questions to facilitate understanding. Here, I think it is most natural to organize the questions around the process that leads to our undesired state.
Takeaway
The graph below shows our current conceptualization of how we come to undesired
states, in general.
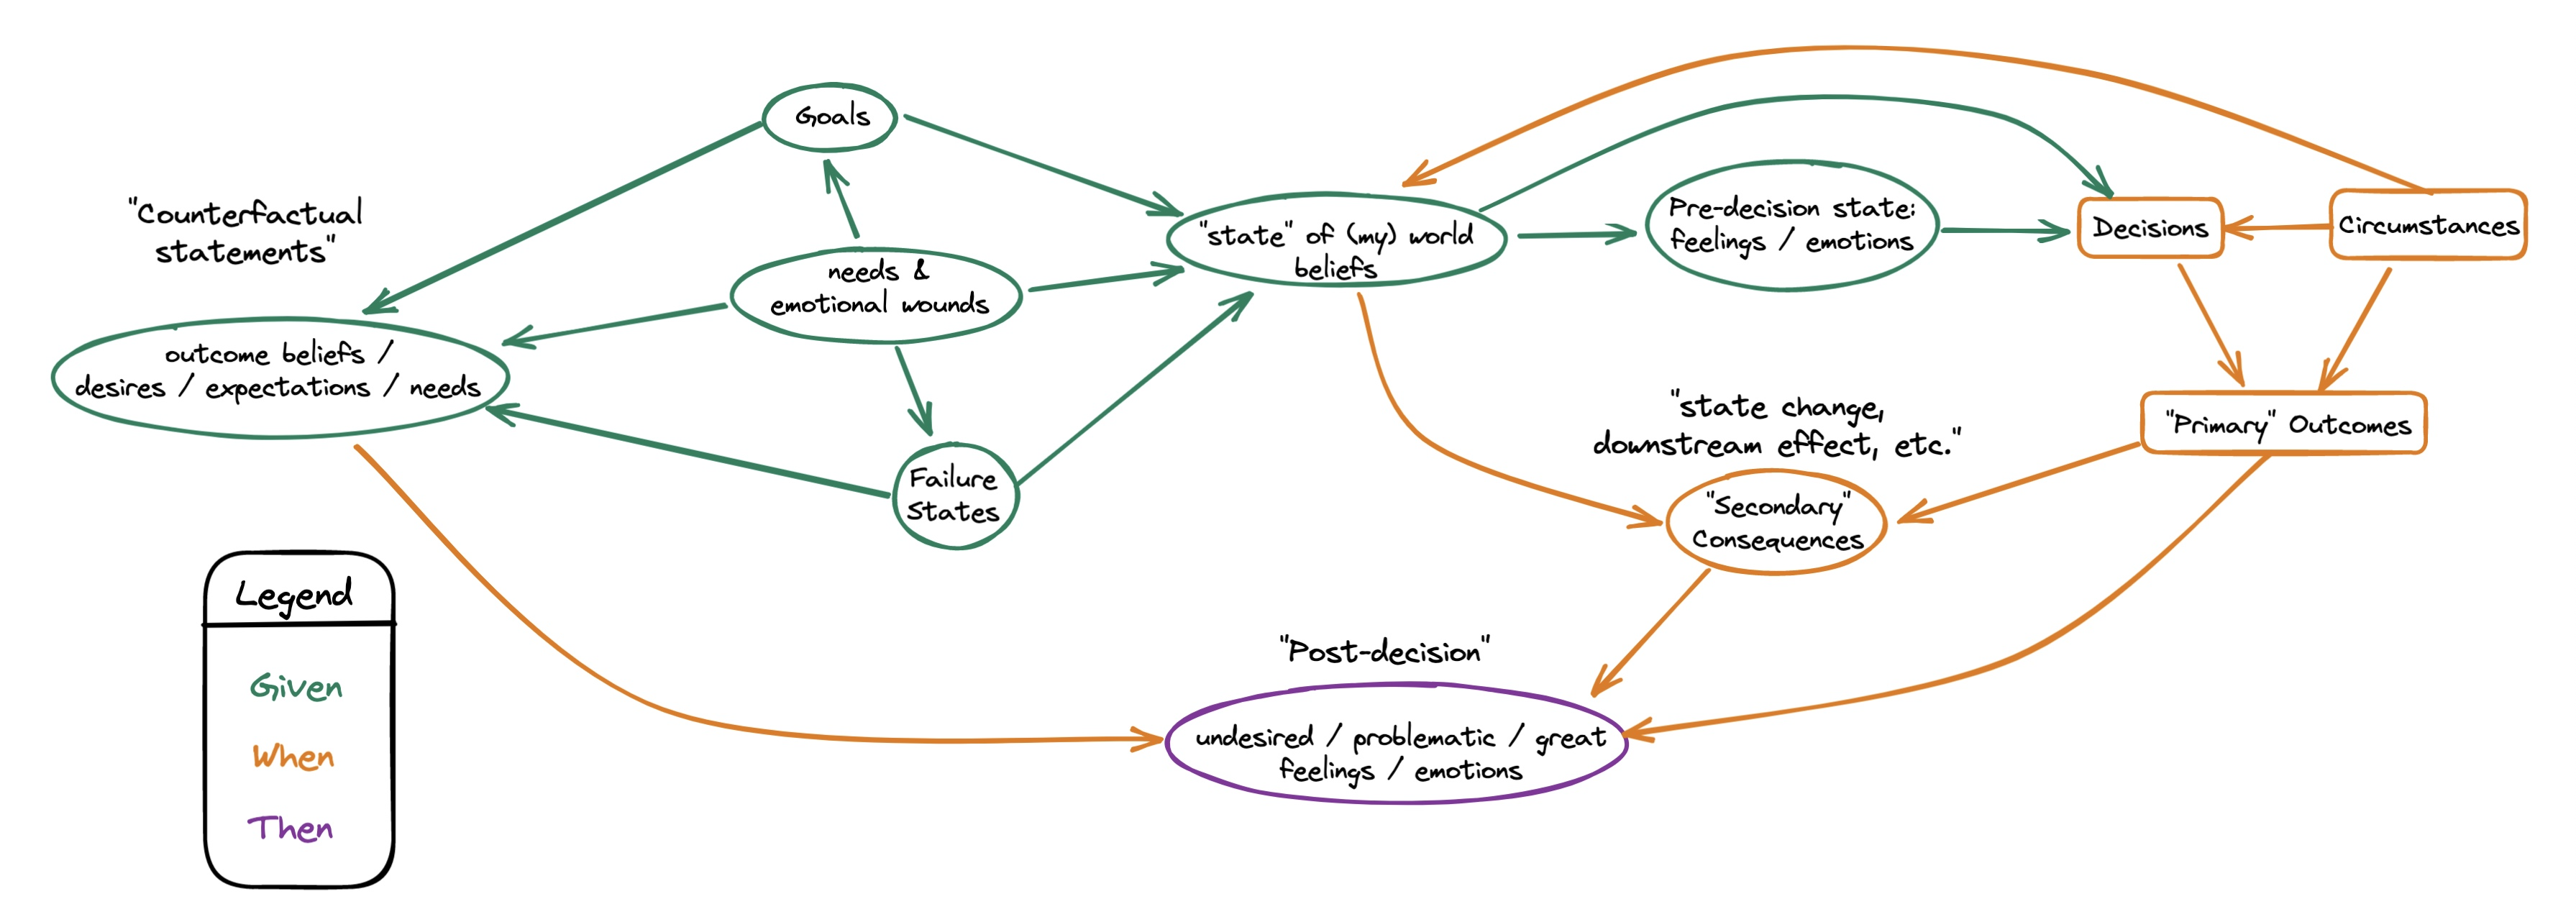 This graph attempts to explicitly delineate an
‘almost-complete’ set of causal factors
that lead to outcomes and feelings that we do not want.
Beyond serving as a tool to convey our current understanding,
this graph can be a map to guide our process of introspection.
This graph attempts to explicitly delineate an
‘almost-complete’ set of causal factors
that lead to outcomes and feelings that we do not want.
Beyond serving as a tool to convey our current understanding,
this graph can be a map to guide our process of introspection.
Relation to previous posts
The introspection graph above extends the causal graph for debugging problems
that I drew in
February:
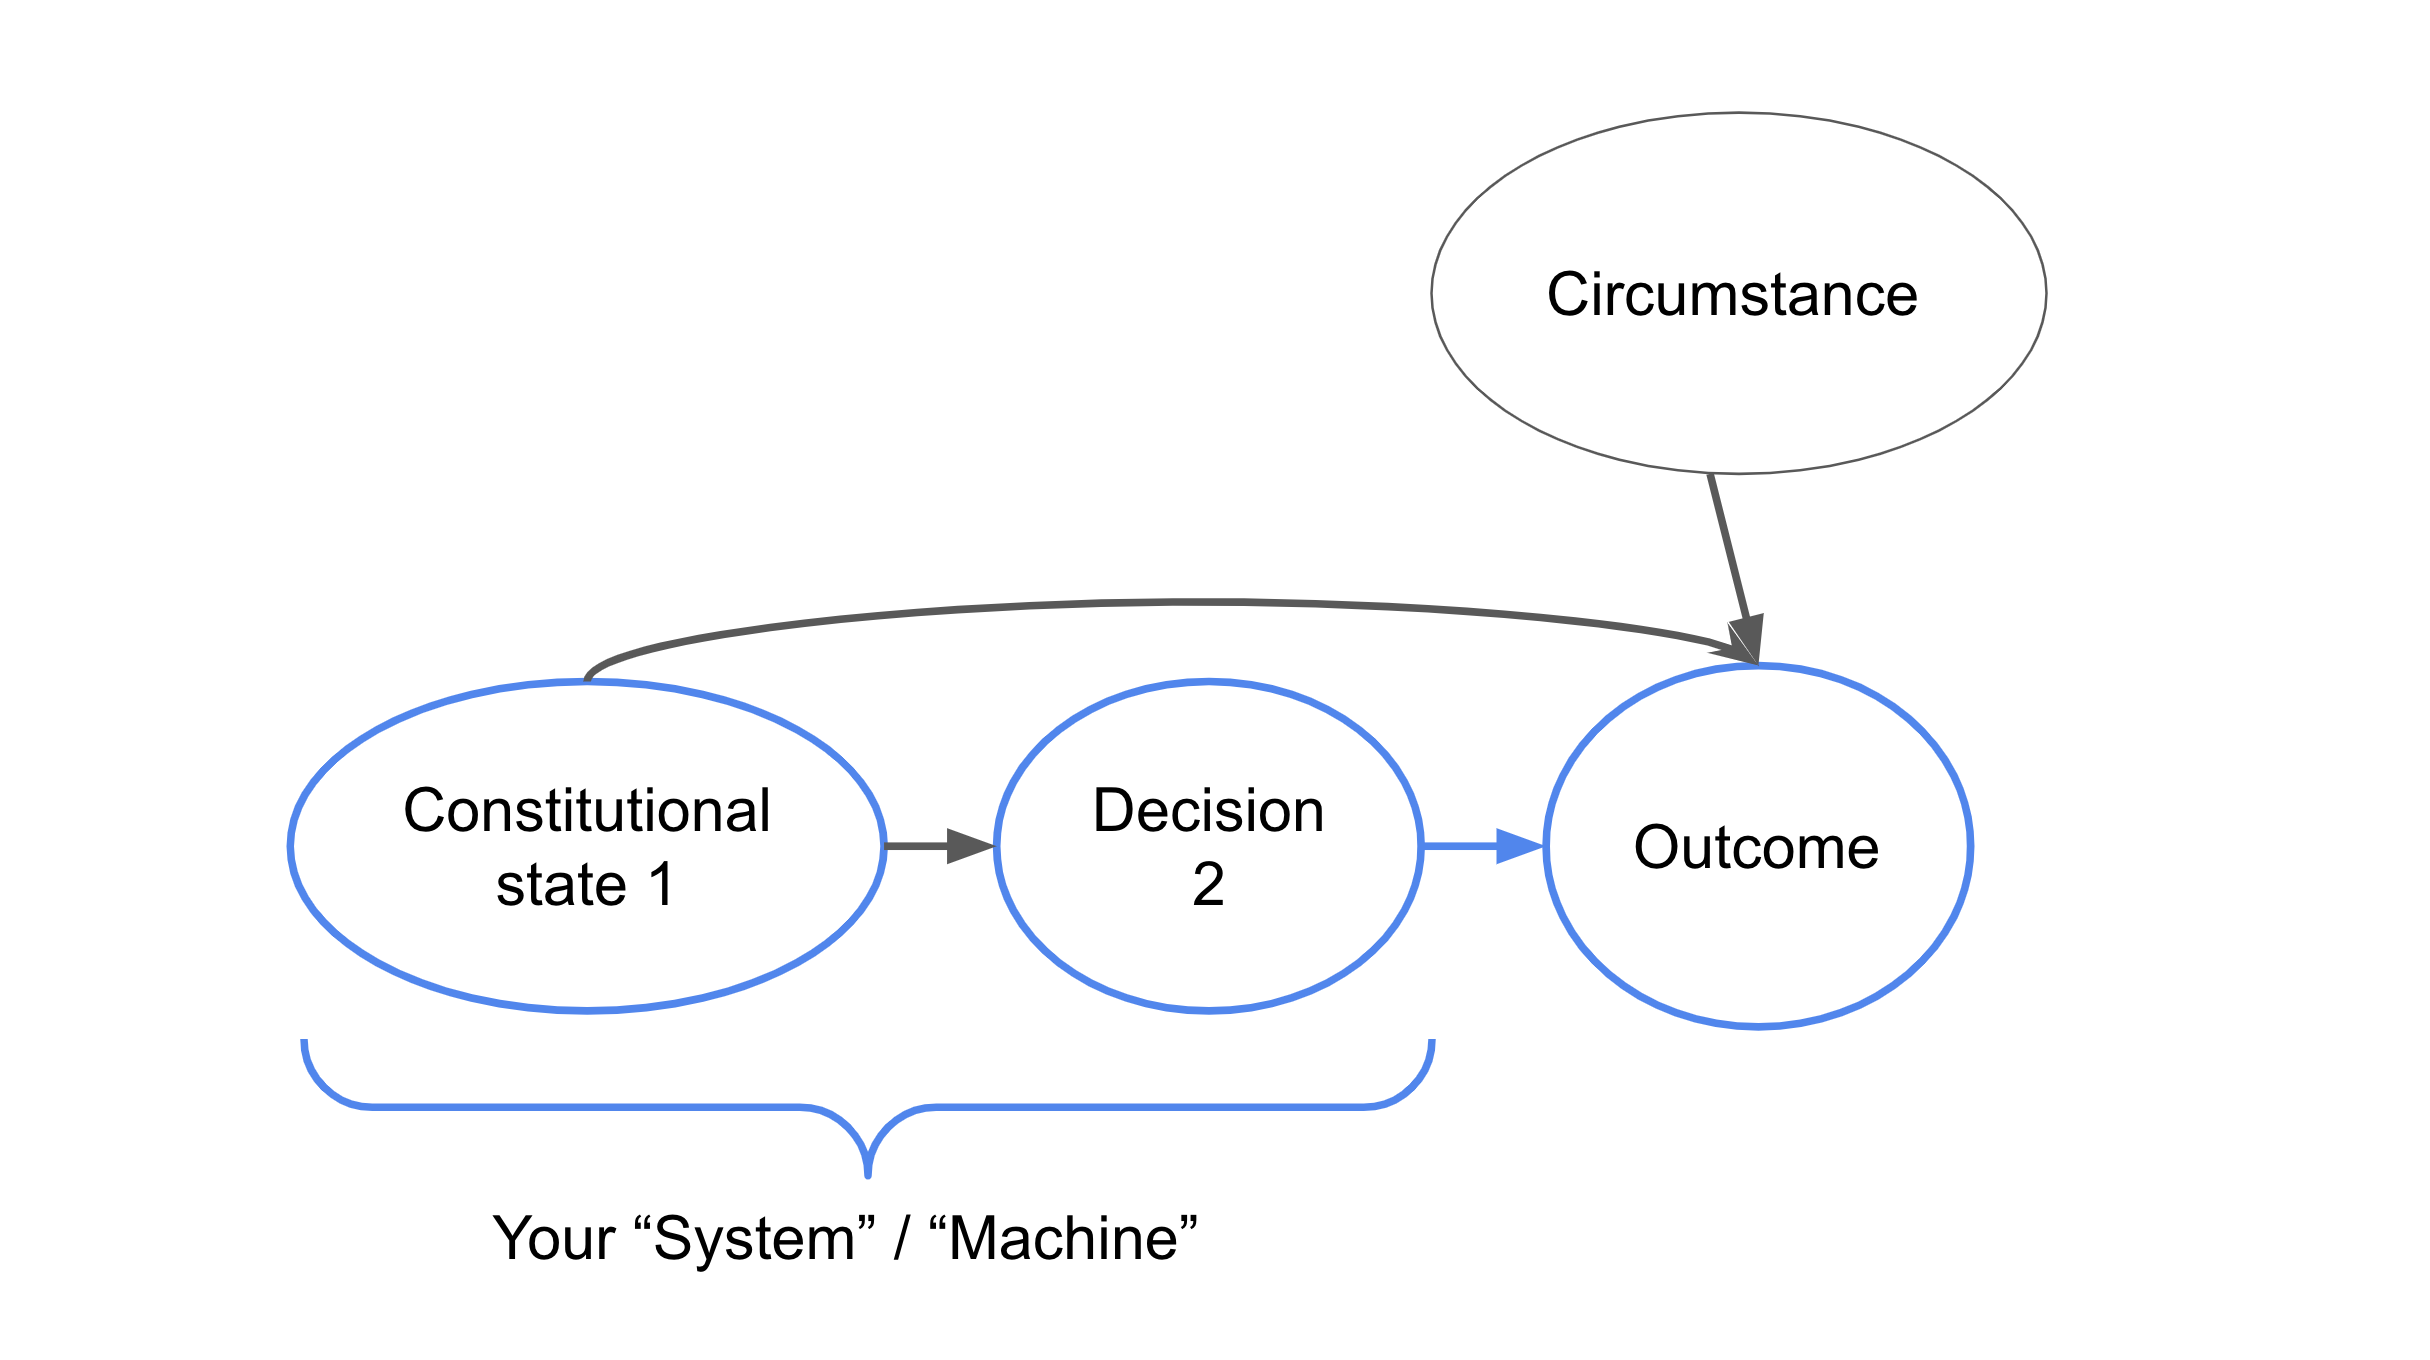 Specifically, the current introspection graph expands the focus of our
problem-solving from ‘objective’ outcomes to include our subjective,
post-decision feelings.
The current graph also expands the ‘constitutional state’ or ‘root cause’ node
to expose the interconnected set of variables that affect our decisions and
post-decision feelings:
Specifically, the current introspection graph expands the focus of our
problem-solving from ‘objective’ outcomes to include our subjective,
post-decision feelings.
The current graph also expands the ‘constitutional state’ or ‘root cause’ node
to expose the interconnected set of variables that affect our decisions and
post-decision feelings:
- beliefs
- goals
- failure-states
- needs
- emotional-wounds
- pre-decision feelings
With this greater specificity, we gain increased insight on where we can intervene to resolve our problems.
Additionally, today’s post relates to May’s note on psychological-optimization. Specifically, the psychological optimization process, as I conceive of it so far, involves three steps: education, introspection, and integration. Today’s post overviews what I mean by introspection.
Introspection elements
To begin, I’ll explain why the introspection graph has its given structure. In particular, many sources have shaped my understanding of how we come to have the feelings and outcomes that we experience.
First, there are the ideas of Nonviolent Communication. Here, the basic premise is that many conflicts arise because of unspecified feelings and needs. Though Nonviolent Communication focuses on interpersonal conflicts, I’ve already described how thinking is internal communication between parts of oneself. Accordingly, the focus on feelings and needs for the resolution of conflicts appears likely to be useful for resolving internal conflicts as well. This motivates the expansion of the causal debugging graph to explicitly denote one’s feelings post-decision and post-outcome.
Second, the role of emotions in driving our decisions is well-known and mercilessly exploited in business applications such as marketing. As a result, we explicitly note our pre-decision feelings and emotions on the introspection graph.
Third, following the learnings of “rational emotive behavior therapy” and “cognitive behavioral therapy,” we note that our beliefs cause our feelings. Here, we draw a distinction between our beliefs about our pre-decision state, leading to our feelings before we make some decision, and our beliefs about the meaning or significance of potential outcomes. These counterfactual beliefs are of the form: if outcome X occurs, then Y. Counterfactual beliefs cause our post-decision feelings, in combination with the actual outcome of the decision and any new, ‘objective’ state we transition into because of our decision’s outcome. Accordingly, we include nodes for both our beliefs about our original state and our counterfactual beliefs, and we include nodes to denote the direct outcome of our decision as well as any secondary consequences of those outcomes.
Fourth, we have two complementary nodes of goals and failure-states. From choice modelling research at one interface of psychology and discrete choice, i.e. within the realm of mathematical psychology, we are reminded that humans (meaning us!) make decisions in pursuit of goals they wish to achieve. Further, positive psychology research reminds us that people have not only goals they wish to actively reach / experience but also undesired or unfavorable failure-states they hope to avoid. These two types of guideposts directly influence what we believe about the world and what we believe about the impact of potential outcomes, hence their placement in the introspection graph.
Finally, we have our underlying needs and emotional wounds. All humans have physical and emotional needs that we attempt to meet. For a non-exhaustive list of such needs (as examples), see here or here. Our goals and failure states are often directly aimed at meeting such needs. Moreover, the degree to which we meet our needs greatly impacts our beliefs about our world.
Likewise, the emotional wounds that we have suffered affect what goals we attempt to achieve and what failure-states we attempt to avoid, all to prevent further hurt. Our wounds also act as a filter through which we interpret the events of life when forming our beliefs. For a non-exhaustive list of such emotional wounds, see here and here.
Suggested use
As stated earlier, I suggest we use the introspection graph to guide our introspection–our asking questions about ourselves. The way I suggest we do this is by answering questions about each node in the introspection graph. This will draw out the story of how our current life’s system generates our undesired feelings and outcomes.
These ‘natural language’ (as opposed to programming language) descriptions are called ‘user-stories’ in software-engineering. The idea is that one’s software system will support or enable these stories. For verification, the stories are often translated into the following template: “GIVEN <some context>, WHEN <something happens>, THEN <something results>.” The introspection graph is color coded to match this format.
As with software engineering, if we don’t like the system’s outputs, we’ll go in and change the system to produce the results we actually want. This presumes we understand the system and its various components. To gain such understanding, we have freedom in how we traverse the graph.
We can proceed one node at a time, asking all questions related to a particular node. We can take repeated tours around the graph, asking one or a few questions at each node, gaining a deeper understanding on each tour. Or, we can use some combination of the two approaches. For now, realize that the choice is ours. Future posts will share some questions that we can ask for each node.
Meanwhile, my default suggestion is to perform repeated tours. It can take a while to ask all questions of interest, so we will likely need more than one questioning session. By performing full tours in each session, we give ourselves some ability to make ‘globally’ informed changes after each questioning session. Additionally, our understanding of a problem often changes in the course of analyzing the problem, and multiple tours expose this in the differing answers to questions within the same node, as seen across tours.
On our questioning tours, I suggest we start by asking questions to clarify our problematic feelings, then we trace the graph “backwards” from the post-decision feelings to our needs and emotional wounds as the last visited node. This follows the order described in February’s debugging post. First we address the immediate problem (i.e. feelings and outcomes), then we address the way we make decisions (i.e. our procedures), and finally we address our constitutional state (e.g. our beliefs, needs, etc.).
Further extensions
To end, I hope we keep in mind that this introspection graph is not ‘complete.’ Some immediately missing elements are nodes to represent our society & culture. Socialization is the internalizing of society’s behavioral norms (i.e. decision-making patterns) and ideologies (i.e. beliefs). If we remain ignorant about how society and our culture affects us, then we remain handicapped in trying to change our resulting decisions and beliefs.
Additionally, I drew this introspection graph from the perspective of intrapersonal problems. I plan to draw a similar graph to represent interpersonal problems, i.e. problems between two or more people. All this to come in future posts!
Until next time Young Tim:
May this introspection graph be of use in
understanding and thinking through your problems!